
By opening the Firebug panel, either above, below or to the side of the currently viewed web page, you can see the page’s source HTML, CSS and JavaScript coding. As seen in below, by clicking on different parts of the code, you will see design elements highlighted on the page.
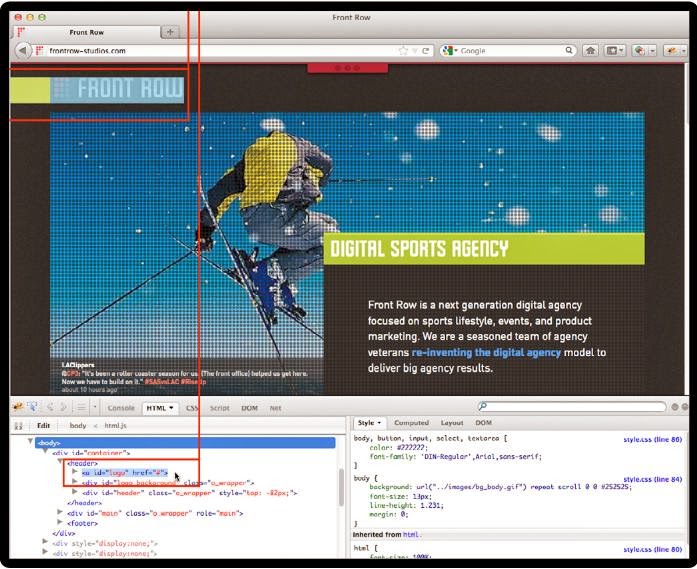
What’s interesting about Firebug is that not only can you highlight different elements of a web page to see the associated HTML and CSS code, you can also edit the code and see what happens – live! For example, as illustrated in below, if I change the name or source path of an image, I can see immediately what would happen.

In this case, the image is not found and all I see is the “alt” text “Front Row”. Don’t worry about making changes that break the page; your changes will not affect the actual source code. It’s simply a way for you to
see and test interrelationships. This ability to edit HTML, JavaScript, and CSS code and see real-time results is an excellent way to teach yourself how to code cool features that you see elsewhere on websites.
Firebug is also an excellent way to troubleshoot your own web pages. For example, let’s say you used
Dreamweaver to build a page. Once you upload it to your server and see the page through the Firefox browser, you may see CSS layout or alignment issues. With Firebug, you can enter different padding, margin, and offset values until the page looks right. You can then go back into Dreamweaver and enter the code that worked best and re-upload the page to your server
No comments:
Post a Comment